
Organizations rarely struggle because they lack process optimization tools. The more common problem is choosing tools before defining what needs to improve.
A team might purchase workflow software when the real issue is an unclear process. It might automate a task that should first be eliminated or apply Lean techniques to a problem caused by uncontrolled variation.
In an industrial setting, it might collect vast amounts of production data without creating the context needed to turn that data into decisions.
The term “process optimization tools” makes this confusion more likely because it covers three different categories: improvement methodologies, analytical techniques, and software.
Lean and Six Sigma are not applications. Process mapping and statistical process control are not complete management systems. A process mining platform and an AI model cannot determine the right business objective on their own.
Effective optimization begins by defining the problem, establishing a measurable baseline, and then combining the appropriate method, diagnostic technique, and technology.
What are process optimization tools?
Process optimization tools are structured approaches used to understand how a process performs, identify the causes of lost performance, implement improvements, and control the resulting process.
They can support objectives such as:
- reducing cycle time and operating costs;
- removing unnecessary steps and handoffs;
- increasing throughput;
- reducing errors, defects, scrap, or rework;
- improving product or service quality;
- stabilizing process performance;
- improving resource and energy use;
- making operational decisions more consistent.
Optimization should produce a measurable difference. A process has not necessarily been optimized simply because it has been documented, digitized, or automated. The change must improve a defined outcome without introducing unacceptable trade-offs elsewhere.
Methods, analytical techniques, and software are not the same
The tools used in optimization can be divided into three layers.
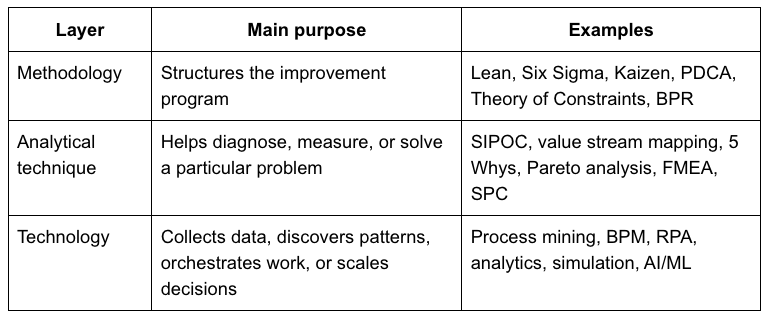
The layers are complementary. A Six Sigma project may use SIPOC during scoping, statistical analysis during diagnosis, and monitoring software during the control phase. A Lean initiative may combine value stream mapping with workflow analytics and automated reporting.
Software becomes valuable when it supports a defined optimization method – not when it substitutes for one.
Start with the process problem, not a software vendor
There is no universal list of the “best” process optimization tools. The right combination depends on the type of performance loss, the available data, and the maturity of the process.
When the process is poorly understood
Start with process mapping. A flowchart shows the sequence of activities, while a swimlane diagram reveals responsibilities and handoffs. SIPOC defines suppliers, inputs, process boundaries, outputs, and customers.
When reliable event logs are available, process mining can reconstruct how the process actually runs. This is useful when documented procedures differ from real behavior or when multiple process variants make manual analysis difficult.
The immediate goal is visibility. Automating an undocumented or poorly understood process may only execute its problems faster.
When waste and waiting dominate
Lean methods and value stream mapping are appropriate when the process contains queues, excessive movement, unnecessary inventory, redundant approvals, rework, or long handoffs.
A current-state value stream map shows how materials and information move through the process. The team can then distinguish value-adding time from waiting and design a more efficient future state.
The key question is not “How can we perform every step faster?” It is “Which steps should exist at all?”
When defects and variation are the problem
Six Sigma and statistical process control are better suited to processes that produce inconsistent outcomes. Examples include fluctuating product quality, unstable cycle times, recurring specification failures, or high rework rates.
Useful techniques include control charts, capability analysis, FMEA, hypothesis testing, and root cause analysis. DMAIC provides the overall structure: Define, Measure, Analyze, Improve, and Control.
This approach requires reliable measurement. Without a valid baseline, teams may mistake normal variation for improvement or react to random changes as if they were meaningful signals.
When one constraint limits throughput
If work accumulates at one machine, approval point, department, or specialist, bottleneck analysis and the Theory of Constraints can help.
The team identifies the constraint, determines how to use its capacity more effectively, and aligns upstream and downstream activities around it. Increasing capacity elsewhere may have little effect if the primary constraint remains unchanged.
Pareto analysis can help prioritize the few causes responsible for the largest proportion of delays or losses.
When work is repetitive and rule-based
Standardized digital tasks may be suitable for workflow automation, BPM, or robotic process automation. Examples include routing documents, transferring data between systems, generating notifications, or applying predefined validation rules.
However, the process should first be simplified. Automating duplicate approvals, unclear exception paths, or unnecessary data entry creates technical complexity without addressing the underlying problem.
When the process is dynamic and data-rich
Some industrial processes cannot be improved through static workflow analysis alone. Their outcomes may depend on changing equipment conditions, production parameters, recipes, material properties, environmental factors, or interactions between multiple variables.
These situations may require statistical modeling, simulation, anomaly detection, predictive models, or prescriptive AI. Such tools can support parameter recommendations and earlier recognition of process deviation, but only when they operate on sufficiently reliable and contextualized data.
Core diagnostic tools for process optimization
A practical toolkit does not need to contain every available technique. It needs to cover the main stages of diagnosis.
Process mapping and value stream mapping
Process mapping visualizes activities, decisions, responsibilities, inputs, and outputs. Value stream mapping adds a stronger focus on material and information flow, waiting, inventory, and value creation.
Both tools help teams compare the documented process with what people actually do.
SIPOC and swimlane diagrams
SIPOC is useful early in a project because it defines the process at a manageable level before the team becomes absorbed in individual tasks.
Swimlane diagrams are particularly valuable when delays arise between departments. They show who performs each activity and where ownership changes.
5 Whys and fishbone analysis
The 5 Whys follows a chain of cause-and-effect questions to look beyond the immediate symptom. A fishbone diagram organizes possible causes into categories such as people, methods, machines, materials, measurement, and environment.
These techniques generate hypotheses. Their conclusions should still be checked against observations and data.
Pareto analysis and FMEA
Pareto analysis ranks causes by frequency or impact so that the team can focus on the most consequential issues.
Failure Mode and Effects Analysis takes a preventive perspective. It identifies potential failure modes, their causes and consequences, and the controls needed to reduce risk.
Statistical process control
SPC uses tools such as control charts to distinguish normal process variation from signals that may require investigation. Capability indicators can then help determine whether a stable process can consistently meet specification limits.
Stability and capability are related but different. A stable process can still perform outside customer or engineering requirements.
Process mining
Process mining analyzes event-log data to discover actual process paths, variants, waiting periods, loops, and deviations from a reference model. It is especially helpful in complex digital workflows where interviews and static diagrams provide only part of the picture.
Process mining reveals what is happening. It does not independently decide which process design best serves the organization.
The main process optimization methodologies
Different methodologies address different types of change.
- Lean concentrates on value, flow, and waste reduction. It is useful for delays, unnecessary movement, excess inventory, rework, and inefficient handoffs.
- Six Sigma concentrates on defects and variation. DMAIC provides a disciplined structure for improving an existing process.
- Kaizen encourages frequent, incremental improvements involving people close to the work.
- PDCA supports iterative testing through Plan, Do, Check, and Act. It is useful when a solution should be piloted and refined before wider implementation.
- Theory of Constraints focuses improvement on the constraint that limits total system performance.
- Business Process Reengineering is appropriate when incremental improvement cannot repair a fundamentally unsuitable process. It involves more radical redesign and correspondingly greater implementation risk.
Organizations can combine these approaches. Lean may expose non-value-adding work, Six Sigma may address variation in the remaining steps, and PDCA may provide the operating loop for testing changes.
Software that supports process optimization
Software categories should be selected according to the role they play in the optimization cycle.
BPM and workflow management
Business process management software can model, execute, monitor, and govern end-to-end workflows. It is useful when processes coordinate people, rules, forms, approvals, integrations, and exceptions across multiple functions.
Robotic process automation
RPA automates repetitive interactions with digital systems. It is most appropriate for stable, rule-based tasks with clearly defined inputs and exceptions.
RPA is an execution tool. It should normally be applied after the process has been standardized and simplified.
Process mining platforms
Process mining software uses event data to discover actual workflows and compare them with intended models. It is primarily a visibility and diagnostic layer, although some platforms also connect analysis with automation.
BI and operational analytics
Dashboards and analytical tools help teams monitor KPIs, compare performance with a baseline, and investigate trends. Their usefulness depends on consistent definitions, appropriate context, and trustworthy source data.
Simulation, digital twins, and AI/ML
Simulation allows teams to test capacity, sequencing, and process scenarios without immediately changing live operations. Digital twins can extend this approach by representing the behavior of a physical asset or process.
AI and machine learning can support forecasting, anomaly detection, predictive maintenance, process deviation detection, and recommendations. They are advanced enablers – not shortcuts around process understanding and data quality.
A six-step process optimization workflow
Most optimization initiatives can follow a common sequence.
- Define the process and objective. Establish boundaries, customers, owners, constraints, and the KPI that will determine success.
- Map the current state. Document activities, decisions, handoffs, systems, data sources, and relevant process variants.
- Establish the baseline. Measure current cycle time, throughput, cost, error rate, scrap, quality, or another relevant outcome.
- Diagnose bottlenecks and root causes. Use observation, process data, mapping, Pareto analysis, 5 Whys, fishbone diagrams, SPC, or process mining.
- Pilot the improvement. Test the proposed change on a controlled scale. Consider its effect on downstream processes, safety, quality, and resource use.
- Control and iterate. Monitor the improved process, define response rules, assign ownership, and feed new findings into the next improvement cycle.
A project should not scale merely because the new design appears more efficient. The pilot must demonstrate that it improves the selected KPI without creating unacceptable side effects.
Process optimization examples
Invoice approval
Suppose invoices pass through several manual reviews and frequently wait for clarification.
Process mapping can reveal duplicate approvals. Process mining can identify where queues and loops occur. A redesigned workflow can standardize approval paths, while RPA may transfer validated data between systems. Results can be monitored through lead time, exception rate, manual touches per invoice, and cost per transaction.
Manufacturing process
A production line may experience variable quality even though individual machines remain operational. Relevant data may be distributed across a historian, SCADA, MES, quality system, ERP, and operator records.
The team can establish a baseline for first-pass yield, scrap, throughput, process stability, and energy use. Statistical and engineering analysis may then identify relationships between operating parameters and outcomes. Any parameter change should be tested within safe constraints and monitored after deployment.
In this example, success depends not only on the analytical model but also on data context, process knowledge, validation, and operational control.
Healthcare intake
A healthcare provider may face long and unpredictable intake times. A swimlane map can expose handoff delays, while queue analysis can show when demand exceeds available capacity. Standardized routing and carefully selected automation may reduce waiting without removing necessary clinical checks.
Relevant KPIs could include waiting time, completion time, error rate, rework, and the percentage of cases requiring manual escalation.
A Practical Tool-Selection Matrix
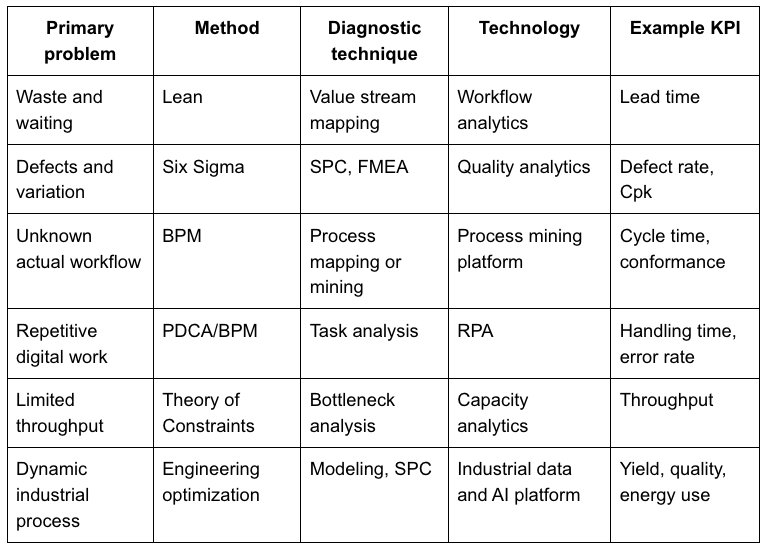
The table illustrates why a product-first selection process is risky. Two organizations may use the same software category for entirely different problems, while similar problems may require different tools depending on data availability and operating constraints.
Where Smart RDM fits in the optimization stack
Industrial organizations often have enough data to analyze a process, but that data may be fragmented across operational and business systems. Measurements can lack context, definitions may vary between sites, and analytical results may remain disconnected from day-to-day decisions.
Smart RDM is positioned as an industrial data and AI platform rather than a generic BPM suite. It supports the connection of OT and IT data, including information from MES, SCADA, ERP, and IoT sources. Its scope includes data quality and preparation, analytics, dashboards, reporting, AI/ML models, and operational decision support.
This makes the platform relevant when manufacturing or process optimization depends on combining data from multiple systems and turning it into consistent operational context.
A broader guide to process optimization methods and tools explains how industrial data platforms fit alongside Lean, Six Sigma, process mapping, SPC, process mining, RPA, and other approaches.
Smart RDM does not replace engineering expertise, process ownership, Lean or Six Sigma. Nor does it replace every source system involved in production.
Its role is to provide a governed data and analytical layer that can support measurement, monitoring, analysis, and more informed operational decisions.
Frequently Asked Questions
What are the most common process optimization tools?
Common tools include process mapping, value stream mapping, SIPOC, 5 Whys, fishbone diagrams, Pareto analysis, FMEA, SPC, process mining, BPM, RPA, simulation, and AI/ML. Methods such as Lean, Six Sigma, Kaizen, and PDCA provide the structure in which these tools are used.
What tools are used in Six Sigma?
DMAIC is the primary framework for improving an existing process. Supporting tools can include SIPOC, process maps, Pareto charts, fishbone diagrams, 5 Whys, FMEA, measurement system analysis, hypothesis testing, control charts, and capability analysis. The appropriate selection depends on the DMAIC phase and the problem being investigated.
What are examples of BPM tools?
BPM tools typically provide capabilities for process modeling, electronic forms, workflow orchestration, business rules, task assignment, system integrations, exception handling, monitoring, and reporting. A BPM platform manages the execution of a process, while a process mapping tool may only document it.
What are the four types of process strategies?
In operations management, the four commonly discussed strategies are process focus, repetitive focus, product focus, and mass customization.
A different four-part classification can be used for improvement programs: incremental improvement, waste elimination, variation reduction, and radical redesign. These broadly correspond to Kaizen or PDCA, Lean, Six Sigma, and BPR. The two classifications answer different questions and should not be treated as interchangeable.
What is the best process optimization tool?
There is no single best tool. Process mapping is appropriate when the workflow is unclear. Lean helps address waste and flow. Six Sigma and SPC address variation.
Process mining reveals actual digital process behavior. BPM and RPA execute standardized workflows, while analytics and AI/ML support data-rich decisions.
The best tool is the one that addresses the diagnosed cause of performance loss and produces a measurable result.
What is a good example of process optimization?
A strong example is a manufacturing team that defines a quality or throughput problem, establishes a baseline, combines production and quality data, identifies the factors associated with poor performance, pilots a controlled change, and monitors the result over time.
The defining feature is not the technology used. It is the complete chain from measurable problems to verified and controlled improvement.
Build the toolkit around the decision
Process optimization should not begin with a list of software products. It should begin with a process boundary, a business objective, and a credible baseline.
From there, organizations can select a methodology that structures the work, analytical techniques that reveal the causes of lost performance, and technology that makes the improved process observable, repeatable, and scalable.
The strongest optimization programs do not use the largest number of tools. They use the smallest coherent set needed to understand the process, improve the right constraint, and prove that the new state performs better.
