• Skip to primary navigation
  • Skip to main content
  • Skip to primary sidebar
  • Skip to secondary sidebar
  • Skip to footer
  • Home
  • Subscribe
  • Your Membership
    • Edit Your Profile
  • Services
    • Advertising
    • Case studies
    • Design
    • Email marketing
    • Lead generation
    • Magazine
    • Press releases
    • Publishing
    • Sponsored posts
    • Webcasting
    • Webinars
    • White papers
    • Writing
  • Shop
    • My Account
    • Cart
  • About
    • Contact
    • Privacy
    • Terms of use
  • Events

Robotics & Automation News

Market trends and business perspectives

  • News
  • Features
  • Video
  • Webinars
  • White papers
  • Press releases
  • Featured companies
    • AMD Xilinx
    • BlueBotics
    • Elite Robot
    • RGo Robotics
    • SICK Sensor Intelligence
    • Vicor Power

Types of Trading Charts and the Information They Provide

April 27, 2021 by Polly Leave a Comment

If you are looking for a way to make your trading sessions successful, you should learn how to use different trading tools that will help you determine trends and decide on your future moves.

Whenever you want to learn about the way a stock or a type of asset is moving, you can rely on trading charts that are easily available online and even on the broker platforms you trade on.

Reading charts is a piece of cake and even newbies can easily get the knack of it. Before you dive into trading, however, you will need to learn about the different variants of charts and the type of information each one of them provides.

We will make sure to cover all important details about trading charts but if you want to learn more on the topic and trading in general, you can always head to Trading Pedia.

What is a Trading Chart?

Prices are very important when trading on the stock or other markets. This is why you will need the help of charts to follow the movements in prices and choose the right time to trade. Trading charts represent the way a stock’s price or value has changed over a certain period of time.

Typically, the stock price or the trading volume are represented across a vertical axis, while the time period covered by the chart is expressed across a horizontal axis.

You may come across different variations of trading charts but there are four main types that are most common among traders. These include line charts, bar charts, candlestick charts, and point and figure charts.

According to the time period you want to view, trading charts can be intraday, daily, weekly, monthly, or annual.

How to Analyze Trend Lines

When you are looking at trading charts, it is always useful to analyze trend lines and trend lengths. Simply explained, a trend line connects all of the low and high values marked on the chart. Sometimes it is difficult to notice trends in technical charts, which is why it is important to know how to analyze trend lines.

Often, charts represent zig-zag patterns that make it difficult to determine whether a stock’s price is going higher or lower. If you, however, use trend lines, you can clear out the confusion and have a better look at the way a stock price or trading volume is moving.

You can use two trend lines, with one of them for the bottom values and one for the top values. Combining both top and bottom trend lines is called creating a channel and it helps traders to determine whether the trend is moving downwards or upwards.

If you notice that both the bottom line and the top line are moving upwards, this means that there is a stable uptrend.

When analyzing charts, it is important to also spot the length of a trend. Typically, primary trends are the ones that last the longest and cause the most drastic changes in stock price. Meanwhile, minor trends, or even secondary trends, tend to last a short period of time, bringing very small movements in stock price or trading value.

Different Types of Trading Charts

As mentioned before, there are four commonly used types of trading charts that will allow traders to understand technical analysis. These include:
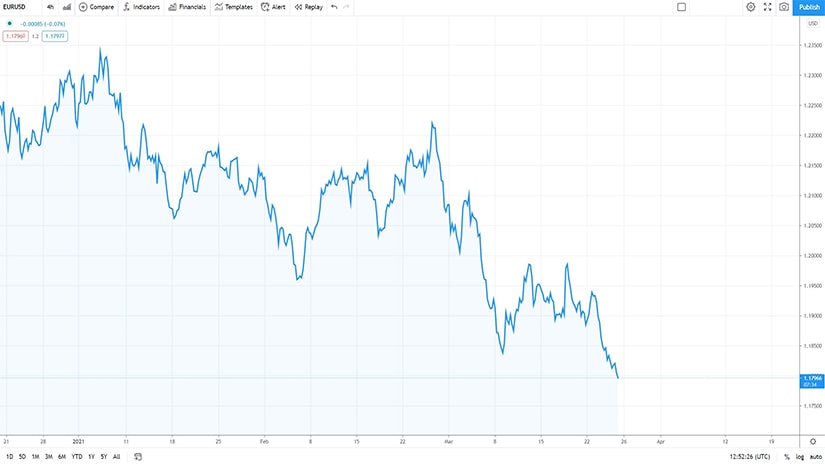
Line Charts

Line charts are what most people think of when they hear the word “chart”, with the stock price or trading volume being represented on the y-axis (vertical), while the time period is shown on the x-axis (horizontal).

To create a line, you will need several dots on the chart, each one of them corresponding to a specific stock price or trading value at a certain period of time. Once all dots have been placed on the chart, they are connected with a line, representing the movement of the stock price or trading value over a specific time.

Bar Charts

Bar charts are very similar to the line charts but they provide even more information. Instead of connecting the dots on the chart with a line, we have each dot marked with a vertical line. Each vertical line has two horizontal lines coming out of it on each side.

The bottom of the horizontal line signifies the lowest price a stock traded at during a specific day, meanwhile, the top part marks its highest trading price for that day.

The left horizontal line shows the opening price of the stock for that day, while the right horizontal line indicates the closing price of the stock. The longer the vertical line is, the bigger the difference is between the opening and closing price of a stock, indicating higher volatility.

Candlestick Charts

Candlestick charts offer the same information as bar charts but they do it in a slightly different way. This type of trading chart is composed of rectangular blocks, with lines coming out of them on each side.

The top line represents the highest trading price for the day, while the bottom line shows the lowest trading price for the same day. The lower and upper sides of the block itself represent the opening and closing price of a stock for that day. Whichever has the higher value is on top of the block.

Point and Figure Charts

This type of chart is less commonly used nowadays as it is quite complex and does not provide that much information as the aforementioned charts do. Point and figures charts represent stock’s volatility over a certain period of time. The vertical axis represents how many times a stock price has declined or rose to a certain point.

Meanwhile, the horizontal axis represents time intervals. Moves on the chart are marked by X’s and O’s, with X’s representing the stock rising above a certain limit, while O’s show the times the stock dropped below a certain point.

Print Friendly, PDF & Email

Share this:

  • Print
  • Facebook
  • LinkedIn
  • Reddit
  • Twitter
  • Tumblr
  • Pinterest
  • Skype
  • WhatsApp
  • Telegram
  • Pocket

You might also like…

Filed Under: Business, Promoted Tagged With: Analyzing Trends, Bar Charts, chart, charts, Line Charts, Point and Figure Charts, price, stock, time, trading, Trading Charts, trend

Join the Robotics & Automation News community

Reader Interactions

You must log in to post a comment.

Primary Sidebar

Latest articles

  • Otto Motors launches new ‘mid-sized’ autonomous mobile robot
  • SGS introduces ‘cutting-edge testing protocol’ for robots checking furniture drawer slides
  • Europalco buys two robots from Kuka to add ‘wow factor’ to shows
  • Kivnon to launch new version of its forklift AGV at Advanced Factories Expo
  • Comau developing new mobile robot solution for three EU projects
  • What is the cost of hiring a Vue.JS developer?
  • Palletizing Systems and Robots
  • DONCEN MOTOR: Flat BLDC Motor is the Future Trend of the Robot
  • Top Benefits of Using Automation in Your Business
  • The Future of Colocation Hosting and How it is Evolving to Meet Changing Business Needs

Most Read

  • Top 20 electric vehicle charging station companies
    Top 20 electric vehicle charging station companies
  • Difference Between Three-Phase and Single-Phase Power
    Difference Between Three-Phase and Single-Phase Power
  • Scientists have found more water in space than they ever knew possible
    Scientists have found more water in space than they ever knew possible
  • Hengbot unveils ‘world’s first robotic dog with musculoskeletal limbs’
    Hengbot unveils ‘world’s first robotic dog with musculoskeletal limbs’
  • Top 20 programmable logic controller manufacturers
    Top 20 programmable logic controller manufacturers
  • How to Know if Your iPhone is Being Tracked? Check This!
    How to Know if Your iPhone is Being Tracked? Check This!
  • Why is My Car Key Stuck in the Ignition?
    Why is My Car Key Stuck in the Ignition?
  • Why is Money Important in Our Lives?
    Why is Money Important in Our Lives?
  • What You Need to Know About Fixing an Engine Misfire
    What You Need to Know About Fixing an Engine Misfire
  • Stiga launches ‘world’s smartest’ autonomous lawn mower
    Stiga launches ‘world’s smartest’ autonomous lawn mower

Overused words

ai applications automated automation automotive autonomous business companies company control customers data design development digital electric global industrial industry logistics machine manufacturing market mobile operations platform process production robot robotic robotics robots safety software solution solutions system systems technologies technology time vehicle vehicles warehouse work

Secondary Sidebar

Latest news

  • Otto Motors launches new ‘mid-sized’ autonomous mobile robot
  • SGS introduces ‘cutting-edge testing protocol’ for robots checking furniture drawer slides
  • Europalco buys two robots from Kuka to add ‘wow factor’ to shows
  • Kivnon to launch new version of its forklift AGV at Advanced Factories Expo
  • Comau developing new mobile robot solution for three EU projects
  • What is the cost of hiring a Vue.JS developer?
  • Palletizing Systems and Robots
  • DONCEN MOTOR: Flat BLDC Motor is the Future Trend of the Robot
  • Top Benefits of Using Automation in Your Business
  • The Future of Colocation Hosting and How it is Evolving to Meet Changing Business Needs

Footer

We are…

Robotics and Automation News was established in May, 2015, and is now one of the most widely-read websites in its category.

Please consider supporting us by becoming a paying subscriber, or through advertising and sponsorships, or by purchasing products and services through our shop – or a combination of all of the above.

Thank you.

Independent

Archivists

April 2021
M T W T F S S
 1234
567891011
12131415161718
19202122232425
2627282930  
« Mar   May »

Complex

Old-skool

This website and its associated magazine, and weekly newsletter, are all produced by a small team of experienced journalists and media professionals.

If you have any suggestions or comments, feel free to contact us at any of the email addresses on our contact page.

We’d be happy to hear from you, and will always reply as soon as possible.

Future-facing

Free, fair and legal

We support the principles of net neutrality and equal opportunities.

Member of The Internet Defense League

Copyright © 2023 · News Pro on Genesis Framework · WordPress · Log in

We use cookies on our website to give you the most relevant experience by remembering your preferences and repeat visits. By clicking “Accept”, you consent to the use of ALL the cookies.
Do not sell my personal information.
Cookie SettingsAccept
Manage consent

Privacy Overview

This website uses cookies to improve your experience while you navigate through the website. Out of these, the cookies that are categorized as necessary are stored on your browser as they are essential for the working of basic functionalities of the website. We also use third-party cookies that help us analyze and understand how you use this website. These cookies will be stored in your browser only with your consent. You also have the option to opt-out of these cookies. But opting out of some of these cookies may affect your browsing experience.
Necessary
Always Enabled
Necessary cookies are absolutely essential for the website to function properly. These cookies ensure basic functionalities and security features of the website, anonymously.
CookieDurationDescription
cookielawinfo-checkbox-analytics11 monthsThis cookie is set by GDPR Cookie Consent plugin. The cookie is used to store the user consent for the cookies in the category "Analytics".
cookielawinfo-checkbox-functional11 monthsThe cookie is set by GDPR cookie consent to record the user consent for the cookies in the category "Functional".
cookielawinfo-checkbox-necessary11 monthsThis cookie is set by GDPR Cookie Consent plugin. The cookies is used to store the user consent for the cookies in the category "Necessary".
cookielawinfo-checkbox-others11 monthsThis cookie is set by GDPR Cookie Consent plugin. The cookie is used to store the user consent for the cookies in the category "Other.
cookielawinfo-checkbox-performance11 monthsThis cookie is set by GDPR Cookie Consent plugin. The cookie is used to store the user consent for the cookies in the category "Performance".
viewed_cookie_policy11 monthsThe cookie is set by the GDPR Cookie Consent plugin and is used to store whether or not user has consented to the use of cookies. It does not store any personal data.
Functional
Functional cookies help to perform certain functionalities like sharing the content of the website on social media platforms, collect feedbacks, and other third-party features.
Performance
Performance cookies are used to understand and analyze the key performance indexes of the website which helps in delivering a better user experience for the visitors.
Analytics
Analytical cookies are used to understand how visitors interact with the website. These cookies help provide information on metrics the number of visitors, bounce rate, traffic source, etc.
Advertisement
Advertisement cookies are used to provide visitors with relevant ads and marketing campaigns. These cookies track visitors across websites and collect information to provide customized ads.
Others
Other uncategorized cookies are those that are being analyzed and have not been classified into a category as yet.
SAVE & ACCEPT