Types of Trading Charts and the Information They Provide
If you are looking for a way to make your trading sessions successful, you should learn how to use different trading tools that will help you determine trends and decide on your future moves.
Whenever you want to learn about the way a stock or a type of asset is moving, you can rely on trading charts that are easily available online and even on the broker platforms you trade on.
Reading charts is a piece of cake and even newbies can easily get the knack of it. Before you dive into trading, however, you will need to learn about the different variants of charts and the type of information each one of them provides.
We will make sure to cover all important details about trading charts but if you want to learn more on the topic and trading in general, you can always head to Trading Pedia.
What is a Trading Chart?
Prices are very important when trading on the stock or other markets. This is why you will need the help of charts to follow the movements in prices and choose the right time to trade. Trading charts represent the way a stock’s price or value has changed over a certain period of time.
Typically, the stock price or the trading volume are represented across a vertical axis, while the time period covered by the chart is expressed across a horizontal axis.
You may come across different variations of trading charts but there are four main types that are most common among traders. These include line charts, bar charts, candlestick charts, and point and figure charts.
According to the time period you want to view, trading charts can be intraday, daily, weekly, monthly, or annual.
How to Analyze Trend Lines
When you are looking at trading charts, it is always useful to analyze trend lines and trend lengths. Simply explained, a trend line connects all of the low and high values marked on the chart. Sometimes it is difficult to notice trends in technical charts, which is why it is important to know how to analyze trend lines.
Often, charts represent zig-zag patterns that make it difficult to determine whether a stock’s price is going higher or lower. If you, however, use trend lines, you can clear out the confusion and have a better look at the way a stock price or trading volume is moving.
You can use two trend lines, with one of them for the bottom values and one for the top values. Combining both top and bottom trend lines is called creating a channel and it helps traders to determine whether the trend is moving downwards or upwards.
If you notice that both the bottom line and the top line are moving upwards, this means that there is a stable uptrend.
When analyzing charts, it is important to also spot the length of a trend. Typically, primary trends are the ones that last the longest and cause the most drastic changes in stock price. Meanwhile, minor trends, or even secondary trends, tend to last a short period of time, bringing very small movements in stock price or trading value.
Different Types of Trading Charts
As mentioned before, there are four commonly used types of trading charts that will allow traders to understand technical analysis. These include:
Line Charts
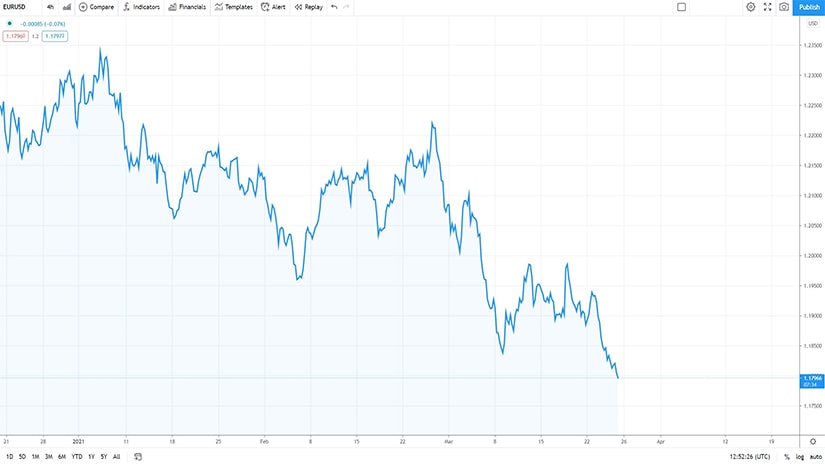
Line charts are what most people think of when they hear the word “chart”, with the stock price or trading volume being represented on the y-axis (vertical), while the time period is shown on the x-axis (horizontal).
To create a line, you will need several dots on the chart, each one of them corresponding to a specific stock price or trading value at a certain period of time. Once all dots have been placed on the chart, they are connected with a line, representing the movement of the stock price or trading value over a specific time.
Bar Charts
Bar charts are very similar to the line charts but they provide even more information. Instead of connecting the dots on the chart with a line, we have each dot marked with a vertical line. Each vertical line has two horizontal lines coming out of it on each side.
The bottom of the horizontal line signifies the lowest price a stock traded at during a specific day, meanwhile, the top part marks its highest trading price for that day.
The left horizontal line shows the opening price of the stock for that day, while the right horizontal line indicates the closing price of the stock. The longer the vertical line is, the bigger the difference is between the opening and closing price of a stock, indicating higher volatility.
Candlestick Charts
Candlestick charts offer the same information as bar charts but they do it in a slightly different way. This type of trading chart is composed of rectangular blocks, with lines coming out of them on each side.
The top line represents the highest trading price for the day, while the bottom line shows the lowest trading price for the same day. The lower and upper sides of the block itself represent the opening and closing price of a stock for that day. Whichever has the higher value is on top of the block.
Point and Figure Charts
This type of chart is less commonly used nowadays as it is quite complex and does not provide that much information as the aforementioned charts do. Point and figures charts represent stock’s volatility over a certain period of time. The vertical axis represents how many times a stock price has declined or rose to a certain point.
Meanwhile, the horizontal axis represents time intervals. Moves on the chart are marked by X’s and O’s, with X’s representing the stock rising above a certain limit, while O’s show the times the stock dropped below a certain point.
