
To consolidate packaging suppliers for a 50-SKU brand, inventory every dieline (or 3-D CAD file), cluster SKUs that share a structure, lock each cluster into a master spec, and quote those identical specs to a small, resilient panel. The data – not guesswork – sets your final supplier count.
The clock is ticking: the EU Packaging and Packaging Waste Regulation takes effect on August 12, 2026 and demands auditable specifications for every pack.
- Capture dielines, CAD files, and tooling
- Normalise dimensions and materials
- Group SKUs into structural families
- Model full-year cost, redesign, or merge where viable
- Bid the common specs with backup capacity
What a dieline reveals
Think of a dieline as the pack’s DNA: every crease, cut, and glue flap laid flat so we can study structure without the distraction of graphics.
Spread that drawing out and hidden costs appear:
- Panels five millimetres taller than the filler needs, adding board volume and freight cube
- Scores that slow a cartoner by 10 packs a minute
- Bleed zones that waste substrate on every run
- Three “different” boxes share the same footprint because the ERP swapped length and width
A single line drawing also shows where automation limits bite, how cartons nest on a pallet, and whether the barcode lands on an unwrinkled face.
California-based packaging design agency Zenpack redesigned Parse’s premium book box into a collapsible, flat-packable version, a single structural change that cut total shipping and storage volume by 80 percent.
Zenpack feeds findings like that into a managed packaging system that standardizes every dieline and material spec across the catalogue, exposing hidden costs before quotes even go out. You’ll never spot that opportunity in an invoice or a supplier catalogue; it lives in the dieline itself.
Where a dieline is not enough
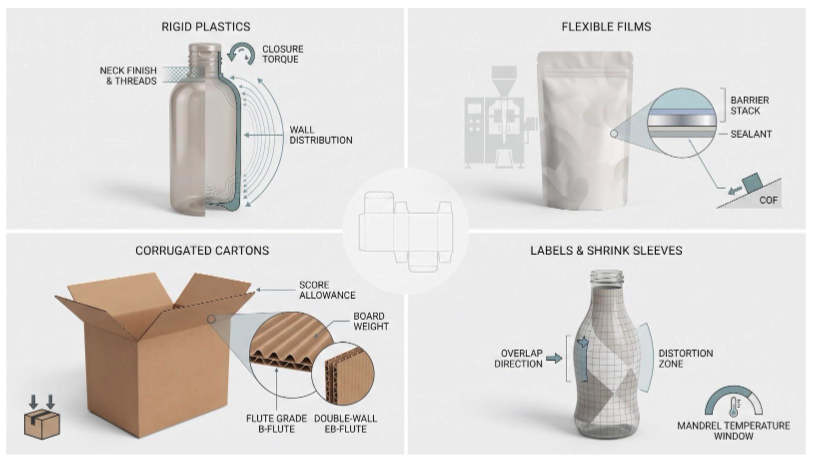
A flat outline is perfect for cartons, labels, and pouches, but some packs hide data you’ll never see on paper.
- Rigid plastics. The critical truths live in a 3-D CAD file: wall distribution, neck finish, thread profile, and target closure torque. Those numbers set mould cost, resin choice, and line speed.
- Flexible films. A printer can match your dieline to the millimetre, then fail at scale because the barrier stack, sealant, or coefficient of friction isn’t in the brief. Low-COF films, for instance, run faster on VFFS machines and avoid heat-seal failures, according to Packaging Digest.
- Corrugated and folding cartons. Flute grade, board weight, and score allowances decide compression strength, pallet yield, and whether a robot erector jams. A FEFCO style code helps, but only a full spec locks performance and cost.
- Labels and shrink sleeves. Over-lap direction, distortion zones, and mandrel-temperature windows decide whether graphics line up or skew around a curve.
The rule: capture the dieline, then bolt on every material, process, and performance attribute; keep the lot under formal revision control so every supplier starts from the same playbook.
Create one row per current packaging item
Open a spreadsheet: give each packaging component its own row (shipper, pouch, label, bottle, tape, insert). For each row, record:
- Product SKU it protects
- Artwork or language code
- Internal and external dimensions, in one unit system
- Material stack or resin, board grade
- Current supplier, and manufacturing site
- Annual volume, and landed spend
- Key quality metrics pulled from the ERP

That single table acts like an X-ray. Patterns surface fast: five cartons differ only by Pantone, two pouches are identical down to the zipper spec, and a bottle with a 28-410 neck finish matches three “unique” SKUs. When complexity becomes visible, it becomes negotiable.
Normalise the data
Raw spreadsheets love chaos: inches here, millimetres there, the odd “inner-dim.” Before clustering, convert every field into a common language.
- Choose one unit system (millimetres for size, grams for mass), then convert line by line.
- Flag each measurement as internal or external so a 3 mm tuck flap never masquerades as product headspace.
- Replace “SMALL BOX V2” with controlled IDs that tie back to your master specs.
- Map formats to standards: corrugated to FEFCO codes, films to gauge and barrier nomenclature, bottles to recognised neck finishes (the GS1 Package Measurement Standard endorses this step).
- Validate material descriptors; swap “strong cardboard” for “B-flute, 150 gsm kraft liner.”
Once the sheet speaks one language, duplicate structures can’t hide behind creative labelling, and true consolidation can begin.
Group only genuinely compatible products
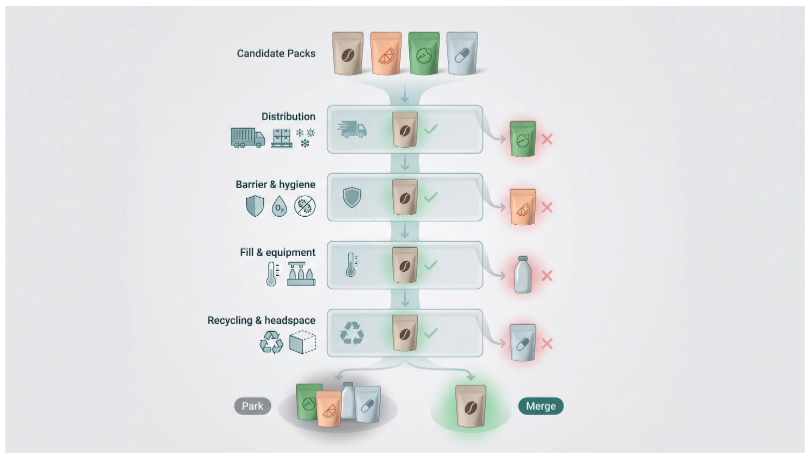
Clean data tempts you to lump look-alikes together, but don’t do it. Score compatibility on what really counts:
- Distribution environment. Humid coastal freight, frozen chain, or dry warehouse lanes all need different board, glue, and tape.
- Barrier and hygiene. Coffee pouches may match the dimensions of vitamin-C powder bags, yet they need tighter oxygen barriers.
- Fill temperature and line equipment. A bottle that runs hot-fill will warp if you force it onto a cold-fill spec.
- Recycling stream and headspace. Identical footprints still fail if one format breaks an automated sort or leaves excess air.
If a candidate clears every gate, mark it as a true merge. Miss even one, and park it for now; better to skip a saving than trash a product.
Prioritise the first wave
With your cluster map ready, choose a pilot family with high spend and low disruption. A common shipper or mid-tier pouch usually beats the signature bottle.
Prove the method, capture total-cost data, and bank goodwill before you roll through the rest. Early momentum funds every next consolidation move.
Assign one of four decisions to every current structure
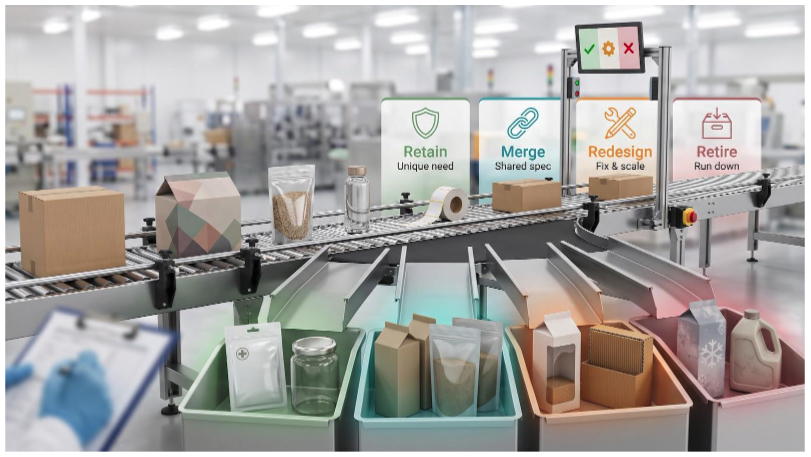
Line each candidate pack up as if you place it on a QC belt, then give it a verdict:
- Retain. Keep the pack as is when it meets a unique technical or commercial need (for example, a sterile medical pouch or a signature glass jar).
- Merge. The pack already meets performance; another SKU can ride the same spec. Update the master, retire the duplicate code, and pool volume.
- Redesign. The pack works today but blocks scale tomorrow – extra headspace or over-spec board. Re-engineer once and roll the benefit across linked SKUs.
- Retire. Dead stock or seasonal curiosities. Run down inventory, pull tooling, and clear the data.
Teams that apply this four-way triage often see real gains. An L.E.K. Consulting study found that SKU rationalisation can add 65-90 basis points to gross margins.
Corrugated and folding cartons
Most brands drift into fractional footprints. Pull those boxes back to one common length × width, then flex height in set increments the line already handles, with no new tooling.
Next, choose one or two FEFCO styles that run cleanly through the erector. Making the carton shape more cube-like can cut material use by 20 percent and improve pallet efficiency, according to a Packaging Digest packaging design study.
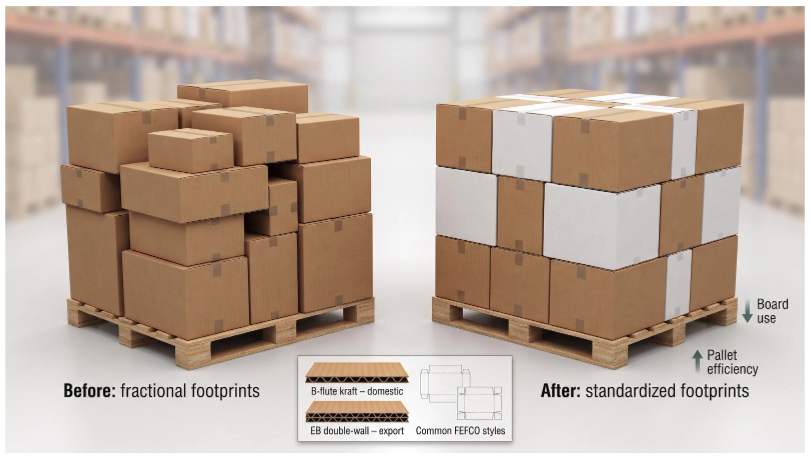
Finally, standardise board: B-flute kraft for domestic loads, EB double-wall for export. With dimensions, style, and board locked, you’ll see longer print runs, faster change-overs, and pallets that stack higher without damage – the outcome the FEFCO Code was built to support.
Validate every proposed common pack
Rationalisation dies without proof. Before you lock a universal bottle or carton, run it through the same gauntlet your line and supply chain face at scale:
- Cut physical prototypes and fill real product at line speed; watch for jams, leaks, or label skew
- Perform drop, compression, and vibration tests on packed units to confirm pallet and parcel survival
- Lab-check seal strength, closure torque, and shelf-life, then scan barcodes under cold-chain condensation
- Approve artwork only after the structure clears every hurdle, then freeze files and issue a formal change notice to suppliers and 3PLs
That discipline turns a one-cent carton saving into a long-term win instead of a recall risk.
Compare total annual cost, not unit price
Annual packaging TCO = purchase cost + tooling and set-up + freight and duties + storage and carrying + obsolescence + quality losses + admin effort + EPR fees
Packaging Digest modelling of rationalised box dimensions found that freight savings outweighed material reductions, which shows why whole-year math matters.
When your team plugs real numbers into that equation, formats that look cheap at the dock often bleed cash in DIM weight, inventory, or rework. Compare the yearly impact, and penny decisions stop sinking pound profits; finance also gains a metric it can track after cut-over.
Does supplier consolidation mean choosing one supplier?
Standardisability versus supply risk
We trim the vendor list with the same discipline we apply to dielines, scoring data rather than gut feel. Two questions steer every decision:
- Standardisability. Can the pack run on multiple lines without tweaks?
- Service impact. What happens to customer OTIF (on-time, in-full) if that pack disappears for a week?
A highly standardisable shipper that rides ambient freight carries little disruption risk, so we can channel volume to the sharpest-priced converter and capture the rebate.
A bespoke medical barrier pouch, by contrast, still needs two qualified plants even after the spec is frozen. That places it high on both axes of a capability-performance matrix, echoing supplier-reduction research by Sarkar and Mohapatra (2006).
In short, the right supplier count sits where technical compatibility meets acceptable business risk. One size never fits all, and that is exactly the point.
How should you score packaging suppliers after standardising the specs?
Your specs, forecasts, and quality plan are locked. Now run a fair race that rewards more than a rock-bottom unit price. Publish a 100-point scorecard upfront:
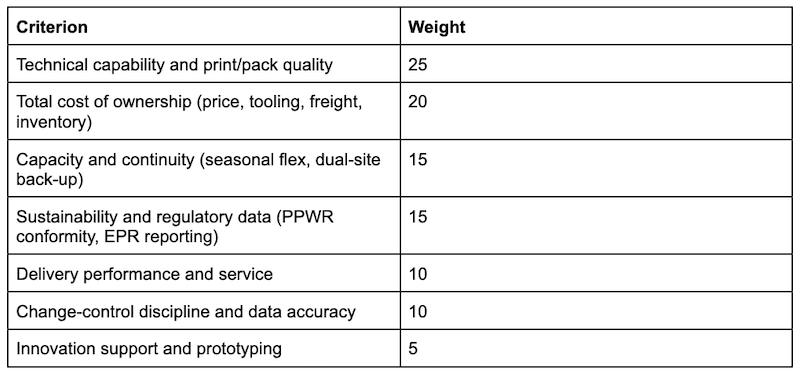
PPWR’s Article 38 requires component-level data by August 12, 2026, so suppliers who automate weight and material reports earn easy points.
When you share the weighting before bids open, negotiation shifts from guesswork to a transparent league table; every vendor knows the rules, and every stakeholder sees why the eventual winner wins.
How do you migrate 50+ SKUs without creating stock-outs?
Ink on the contract is barely dry, but your production line won’t wait. A four-phase roll-out keeps shelves full and obsolete stock at bay.
- Governance. One executive sponsor owns the deadline, and a master-data steward controls file versions. Freeze avoidable new structures during the window; complexity in means complexity out.
- Pilot. Launch the rationalised pack within a contained family. Run incumbent and new supply in parallel until speed, quality, and fill rates match the baseline, then taper old purchase orders and bleed warehouse stock.
- Cut-over checklist. Update ERP and WMS item codes, alert 3PLs, revise retailer pack instructions, confirm GTIN dimensions, and stage rollback inventory in case metrics slip.
- Scale. Repeat tranche by tranche, tracking defect rate, lead time, and landed cost after each wave. Measured, phased change keeps cartons moving and customer-service tickets silent, a strategy that paid off for Mattel: its phased supply chain project cut SKUs by 30 percent and saved about $797 million over two years.
Where do digital twins, AI and digital printing fit?
Digital tools can turbo-boost consolidation efforts, but they never replace engineering judgment.
- Digital twins. A validated master dieline becomes a 3-D model. Teams drop new artwork, languages, or icons onto the twin and see it on a virtual shelf within minutes. Nestlé reports that this cut localisation lead time by about 70 percent across 4 000 SKUs. Speed rises, and the structural SKU count stays flat.
- AI. Machine learning scrapes ERP data, flags near-duplicate dimensions, and forecasts demand spikes that could blow inventory targets. It can even scan artwork for missing recycling symbols. What it can’t do is sign off a production dieline; that still goes through packaging engineering and quality.
- Digital printing. Once structures are standardised, late-stage customisation shifts from logistical headache to just-in-time execution. One pouch can carry 50 flavours, five languages, and a holiday promo, printed only when orders land. Inventory drops and obsolescence shrinks.
Together these tools keep your portfolio tight while letting brand and market teams move at campaign speed, stopping complexity from creeping back in the door.
How do PPWR, EPR, and sustainability change the consolidation decision?
Regulation shifts consolidation from a cost-only play to a data-ready one.
- PPWR. From August 12, 2026 every pack sold in the EU must carry auditable technical documentation. When you centralise dielines and specs, you build that evidence base automatically.
- EPR in the United States. Seven states now have packaging EPR laws, and an industry council has released an open-source template that captures component weight, material code, and recyclability status for each SKU, reports Packaging Dive. Consolidation makes those asks livable: fewer structural specs mean fewer BOM lines to measure and fewer suppliers to chase for certificates.
Why consolidation helps
- Trim one gram from a high-volume common shipper and you cut both freight and EPR fees across half the catalogue.
- A single master spec stores recycled-content percent, labelling claims, and end-of-life route – ready for PPWR audits or retailer scorecards.
- Fees flow cleanly back to the right product P&L, so finance can see the impact of redesigns in real time.
In short, fewer, better-governed specs turn regulatory headaches into manageable line items and give sustainability teams data they can trust.
Which KPIs prove that supplier consolidation is working?
Freeze a baseline before your first dieline audit, then track the same dashboard at 30, 60, and 90 days after each migration wave.
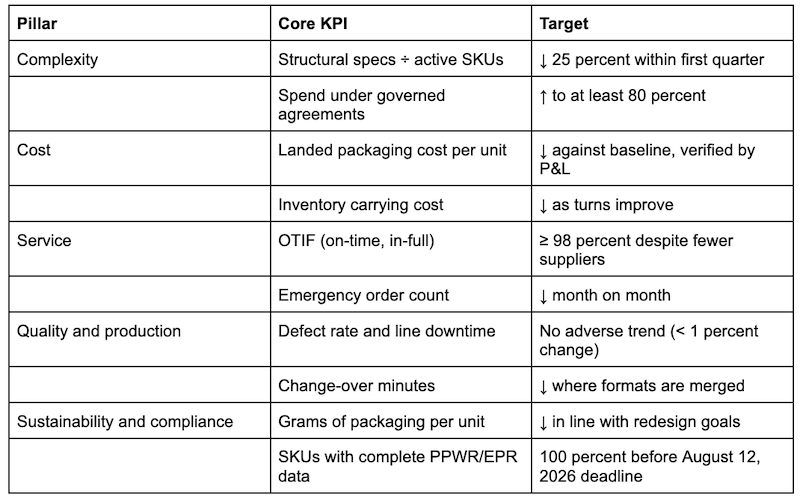
If any KPI drifts the wrong way, pause the next tranche, fix the root cause, and only then roll forward. Numbers, not anecdotes, show whether specification-first consolidation delivers more than a tidy supplier list.
What should the first 30 days look like?
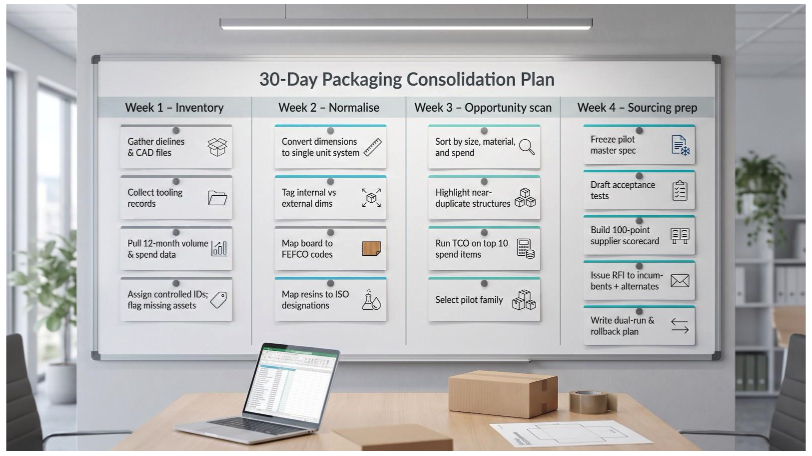
Week 1: inventory
Gather every dieline, CAD file, tooling record, and 12-month volume report into one folder. Assign controlled IDs and flag assets the brand doesn’t yet own.
Week 2: normalise
Convert all dimensions to a single unit, tag internal versus external, and translate board names to FEFCO codes while mapping resins to ISO designations. The sheet shifts from gossip to governed data.
Week 3: opportunity scan
Sort by size, material, and spend. Near-duplicates light up. Run TCO on the ten highest-spend items, choose one family as the pilot, and map single-source risk.
Week 4: sourcing prep
Freeze the pilot’s master spec, draft acceptance tests, and build the 100-point supplier scorecard. Issue a request for information (RFI) to incumbents and two alternates, then write the dual-run and rollback plan.
After 30 days you hold clean data, a proven methodology, and a pilot ready for press – momentum you can use before complexity creeps back.
Frequently asked questions
Can one packaging supplier handle 50 plus SKUs?
Yes, when those SKUs share a handful of governed structural specs. Pool the volume under one master agreement and keep a qualified backup for any pack that would stop production if that supplier falters.
How many suppliers should a multi-SKU brand keep?
Let data, not habit, decide. Low-risk, highly standardisable packs may sit with one converter, while high-risk or specialised formats usually need two qualified sites, as capability-performance research by Sarkar and Mohapatra (2006) recommends.
What’s the difference between SKU rationalisation and supplier consolidation?
Rationalisation removes duplicate structures. Consolidation then redirects the remaining spend to a smaller, better-scored vendor panel. Nail the first step and the second becomes safer.
Can several SKUs share one dieline?
Absolutely. Swap artwork, language, or seasonal graphics while the cut, crease, and glue pattern stays fixed – often cutting minimum order quantities by about 30 percent in digital-print studies.
Who should own packaging dielines and tooling?
The brand should. Holding native files and moulds keeps suppliers competitive and ensures fast access for audits or re-quotes.
How do shared structures affect minimum order quantities?
MOQs usually fall because five artwork versions on one pouch aggregate orders and hit press-run thresholds sooner.
How can we consolidate suppliers without increasing stock-out risk?
Run critical packs in parallel during validation, keep incumbent tooling live until the new line meets service KPIs, and embed business-continuity clauses in every contract.
What data do we need for PPWR and EPR reporting?
Capture component weight, material code, recycled-content percent, recyclability claim, conformity tests, and the approved production site for each spec – the fields the EU’s PPWR guidance calls “technical documentation.”
Conclusion – a smaller supplier list is the outcome, not the goal
Supplier consolidation succeeds only when it stands on disciplined specification control. Map every dieline, merge structures where the data say you can, and let that clarity drive competitive sourcing.
You’ll finish with fewer uncontrolled SKUs, verifiable data for PPWR/EPR, and a vendor panel measured on performance – not guesswork.
Begin with the 30-day audit: pull the files, clean the sheet, choose the pilot. Shrink complexity first; cost, resilience and sustainability will follow.
