Jira dashboards display real-time project information through gadgets that pull data from the system. Without filters applied, gadgets show all issues across all projects, creating information overload that obscures relevant details.
Adding filters to dashboard gadgets focuses displayed data on specific projects, teams, or criteria, transforming generic views into targeted management tools.
Teams learning to add filters to Jira dashboard components create personalized views that surface critical information immediately.
According to Atlassian’s dashboard configuration guidance, dashboards function as living pages that teams should tweak and evolve as needed, with saved filters keeping important items in plain sight so critical work does not slip through the cracks as projects move forward.
Select Gadgets That Support Filter Configuration
Not all Jira gadgets accept filter inputs. Understanding which gadgets support filters determines dashboard configuration options. Filter-compatible gadgets provide more targeted data displays than gadgets with fixed data sources.
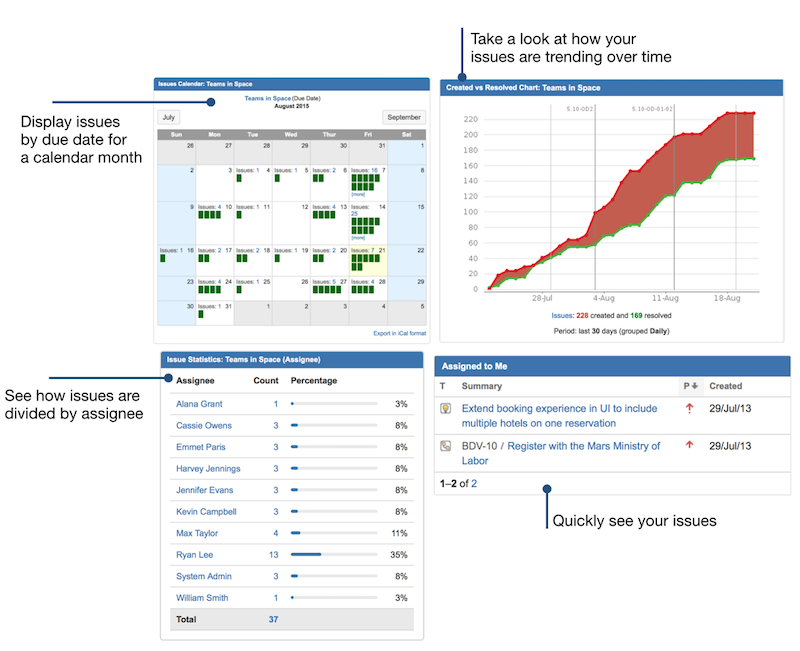
The Filter Results gadget displays issue lists based on the currently selected filter. This gadget shows detailed issue information: keys, summaries, statuses, assignees, and priorities. Users click issues to view full details.
Configuration requires selecting a saved filter from the dropdown and choosing which columns to display. This gadget is well-suited for detailed work tracking, where users need to see individual issues.
The Issue Statistics gadget shows issue counts grouped by any field. Configuration requires a saved filter plus a statistic type: status, priority, assignee, component, or any custom field.
The gadget displays results as bar charts showing relative volumes. This gadget answers questions such as “How many high-priority bugs remain?” and “Which team member has the most assigned work?”
The Two-Dimensional Filter Statistics gadget breaks down issues across two fields simultaneously. Configuration requires a saved filter, an X-axis field, and a Y-axis field.
The resulting table shows issue counts at each intersection: priority by assignee, status by component, issue type by project. This cross-tabulation reveals patterns that single-dimension views miss.
Create Filters Before Adding Them to Gadgets
Dashboard gadgets reference saved filters rather than inline JQL queries. This design requires creating and saving filters before configuring gadgets. The two-step process separates query definition from visualization configuration.
Navigate to the Issues menu and select Search for Issues to open the filter creation dialog. Use basic search for simple criteria or advanced search for JQL queries.
Basic search provides dropdown menus for common fields: project, assignee, status, and priority. Advanced search accepts full JQL syntax for complex conditions. Construct queries that return the issue set the gadget should display.
Save the query as a named filter after verifying it returns correct results. Click the Save As button above the results list. Enter descriptive filter name indicating purpose and scope: “Platform Team – Sprint Backlog” or “Critical Bugs – Unassigned”.
Set sharing permissions to make filters available to dashboard viewers. Filters must be shared with users who will view gadgets referencing them.
According to research on gadget configuration from Amoeboids, preconfigured filters serve as the underlying data source for dashboard gadgets. Most gadgets offer configurations that make them flexible across various situations, thereby playing a pivotal role in maximizing transparency and boosting productivity when used properly.
Filter permissions determine who can view gadget data. Private filters show data only to filter creators. Group-shared filters provide access to specific user groups. Publicly shared filters let all Jira users view results.
Dashboard gadgets referencing private filters display permission errors to users without filter access. Ensure filter sharing settings match the intended dashboard audience.
Configure Gadgets With Selected Filters
After creating saved filters, add and configure gadgets on dashboards. Each filter-compatible gadget includes configuration screens where users select which filter provides data. Configuration steps vary by gadget type but follow similar patterns.
Add gadgets to dashboards through the Add Gadget dialog. Click the Edit Dashboard button to enter edit mode. Click Add Gadget button to open the gadget directory. Browse by category or search by name to locate desired gadgets. Click the Add button next to the gadget names to add them to the dashboard. Gadgets ship with default configurations that require further setup.
Configure newly added gadgets by clicking their configuration icons. Most gadgets display a wrench or gear icon when the dashboard is in edit mode. Click the configuration icon to open the settings panel. Locate the Filter dropdown or Filter field within the settings.
Select the saved filter that should provide data to this gadget. Some gadgets require additional configuration beyond filter selection: statistic types for Issue Statistics, column selection for Filter Results, and axis fields for Two-Dimensional Statistics.
Save the gadget configuration to display filtered data. Click the Save button in the gadget settings panel. The gadget refreshes to display data filtered by the selected filter. Verify the gadget displays expected information before exiting edit mode.
If the results appear incorrect, check the filter JQL and sharing permissions. Permission errors or empty results indicate configuration issues that require troubleshooting.
Update Filters Without Reconfiguring Gadgets
The separation between filters and gadgets provides flexibility. Modifying the filter JQL updates all gadgets that reference it automatically. This architecture means that changing query criteria does not require reconfiguring multiple dashboard gadgets.
Edit existing filters through the filter management interface. Navigate to Issues menu and select Manage Filters. Locate the filter needing modification in the filter list. Click the Edit link to open the filter in advanced search view.
Modify JQL query to add, remove, or change criteria. Save the filter with the updated query. All dashboards and gadgets referencing this filter immediately reflect the new query results.
Filter updates propagate to gadgets in real time. When users view dashboards after applying filter modifications, gadgets display data that matches the current filter definition. This immediate update eliminates the need to manually refresh multiple gadgets or reconfigure dashboard layouts.
Teams can refine filter criteria iteratively without disrupting dashboard structure.
Name changes to filters do not break gadget references. Jira gadgets reference filters by internal ID rather than name. Renaming a filter for clarity preserves all gadget configurations.
However, deleting filters breaks references to gadgets. Gadgets referencing deleted filters display errors. Before deleting filters, verify that no active dashboards reference them, and plan to reconfigure any affected gadgets with replacement filters.
Adding filters to Jira dashboard gadgets transforms generic data displays into focused management tools. Filter-compatible gadgets like Filter Results, Issue Statistics, and Two-Dimensional Statistics accept saved filters as data sources. Creating and sharing filters before configuring gadgets ensures proper permissions and data access.
Gadget configuration screens link saved filters to visual displays. The separation between filter definition and gadget presentation allows query updates without dashboard reconfiguration. Teams mastering this workflow create maintainable dashboards that evolve with changing project needs.
